Getting Started with Littlefield Labs
Introduction
Littlefield Laboratories is a highly automated, state-of-the-art service provider specializing in individual blood tests. Customers pay premium prices for shorter lead times and there are several competing companies offering similar services. Littlefield differentiates by guaranteeing lead times. Their guarantee offers rebates for all jobs shipping after a quoted time. These rebates are prorated until an order exceeds the maximum quoted time. Orders delivered after maximum quoted times, are provided free of charge.
Blood samples arrive from hospitals and clinics as customer orders. Processing each sample requires a disposable test kit, which is fully consumed during the process. Fresh test kits come from a reliable supplier who delivers inventory into the laboratory???s Materials Buffer. Orders become jobs as each customer???s blood sample is matched with a test kit.
Littlefield has a four-step reentrant process carried out over three machine stations called the sample preparing, testing and centrifuging stations. A graphic representation of their laboratory???s flow appears below:
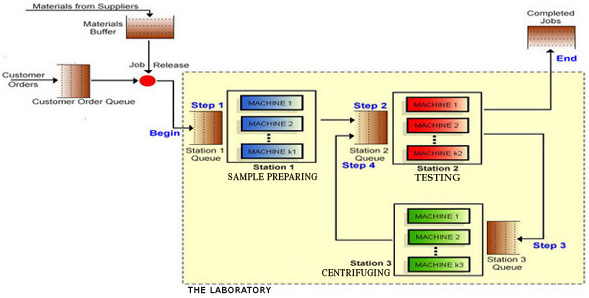
All stations consist of fully automated machines performing specific transformations. In step-one at Station 1, blood samples are transferred to test tubes containing reagents and prepared for testing. Initial tests are performed in step-two. In step-three, blood samples are centrifuged at Station 3 to separate plasma, white, and red blood cells. In step-four, all jobs return to Station 2 for final testing and electronic transmittal of those results to the customer.
Your team will manage Littlefield???s Laboratory with the goal of maximizing profitability. Specific details about Littlefield???s process are provided in your instructor???s assignment. Every team???s performance is measured against those of competing teams and a donothing team. Total cash in hand, at any given moment, determines each team???s rank.
Registering your team
Students will need to register with a team before the simulation begins. Your instructor will provide a link, ending /start.html, and a course codeword. Each team must invent a memorable name and password consisting of only lower-case letters or numbers???please no dots, dashes, spaces or other punctuation.
An image of the registration page appears below:
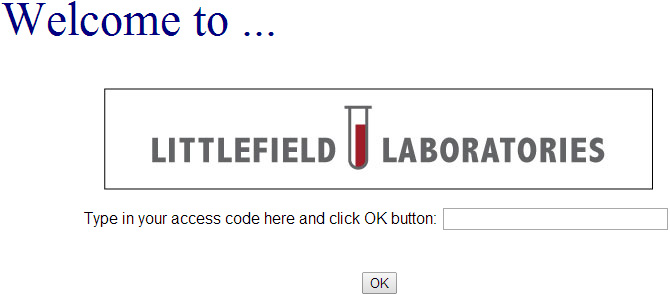
Enter your course codeword and click the OK button. On the subsequent page, enter your team???s name and password. After a student creates the team, other members will be able to join using an identical team name and password. You may use upper case letters and spaces to distinguish first and last names, but please omit any apostrophes used in names like O???Malley. If your instructor provides a section ID for your team, please enter this number in the small field at the top of your page. Changes take effect after the submit button is clicked. Students may change their team???s name, password, or membership by logging into this registration page and editing the appropriate fields. To delete a team, erase all members??? names to submit an empty team. You will not be able to reenter this page after the simulation begins.
Accessing your factory
Once the simulation begins, your instructor will provide a web link ending /entry.html. Opening that link will provide the login window illustrated below.
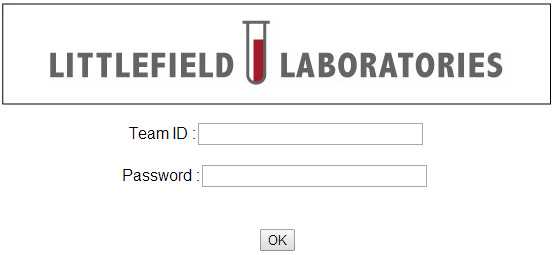
You can enter your laboratory using your team name and password.
You must have both the Java plug-in and JavaScript enabled in your browser; they are included as default settings in most browsers. Please also allow pop-ups while using this software.
Using the simulator
This web-based simulator runs continuously. If you view the site at 10 am and then view it again at 1 pm, on the same day, you will notice some simulated time has elapsed. You have no control over the simulator???s clock. You may need to wait several hours to see the effects of your actions.
You may access your lab 24 hours a day. Your lab will quickly run its final simulated days when the assignment ends. After the simulation ends, you may review the final status of your lab and download historic data but the lab will no longer be active.
Clicking icons in the schematic, previously illustrated on page one, will reveal menus which control the lab???s performance and provide historic data. The specific information available from each icon is listed on the last page of this document.
Your lab status is automatically updated upon login. To update lab status after login, please click the update button found on the control bar at the bottom of your schematic. In light of the relatively slow speed of this simulator, there is no point to frequent updates.
Downloading laboratory data for in-depth spreadsheet analysis is recommended. Below each data plot you will find a download button. Clicking this button will initiate the download of a tab-delimited text file, containing the exact data points displayed on that plot. Save this file to a temporary location, and open with your spreadsheet application.
Data points are recorded for the ending values of each simulated day. Littlefield???s inventory plot uses a slightly different day index which permits fractional days. New shipments of inventory arrive at any point in time and stockouts could also happen at any time. When these events take place, the beginning and ending inventories are recorded in fractions of a day.
You may notice a few days where zero jobs exit the lab. On such days, daily average lead times and daily average revenues are meaningless. A value of zero will appear in your plots on such days.
Cash on hand at game???s end is the only winning condition.
Icons on the Littlefield Technologies web page:
| ICON | INFORMATION AVAILABLE |
|---|---|
Order Queue: |
|
Materials Buffer: |
|
Station Queues: |
|
Stations: |
|
Completed Jobs: |
|
Clicking on the above icons will enable changes to specific features of the laboratory. Your assignment???s handout will explain which features you may change.

Sources and uses of cash may be obtained by clicking the cash button on your lab???s control bar. Sources of cash are revenue, machine resales, and interest earned on cash held. Uses of cash are raw material inventories and machine purchases. Clicking the history button will reveal your team???s actions to date. Clicking the update button will refresh your screen. Clicking the quit button will exit the lab. Clicking the overall standing button will show your team???s relative rank.